BMI Chart Explained: What Your Number Really Means
Understanding your BMI categories is a vital step in assessing your health risks and body composition.
A BMI chart is a tool used by healthcare professionals to determine whether a person is within a normal BMI range. By comparing weight and height, the Body Mass Index provides a statistical baseline used worldwide to screen for weight-related health issues.
BMI Categories (CDC Standard)
The Centers for Disease Control and Prevention (CDC) and the World Health Organization (WHO) use the following standardized BMI categories for adults aged 20 and older:
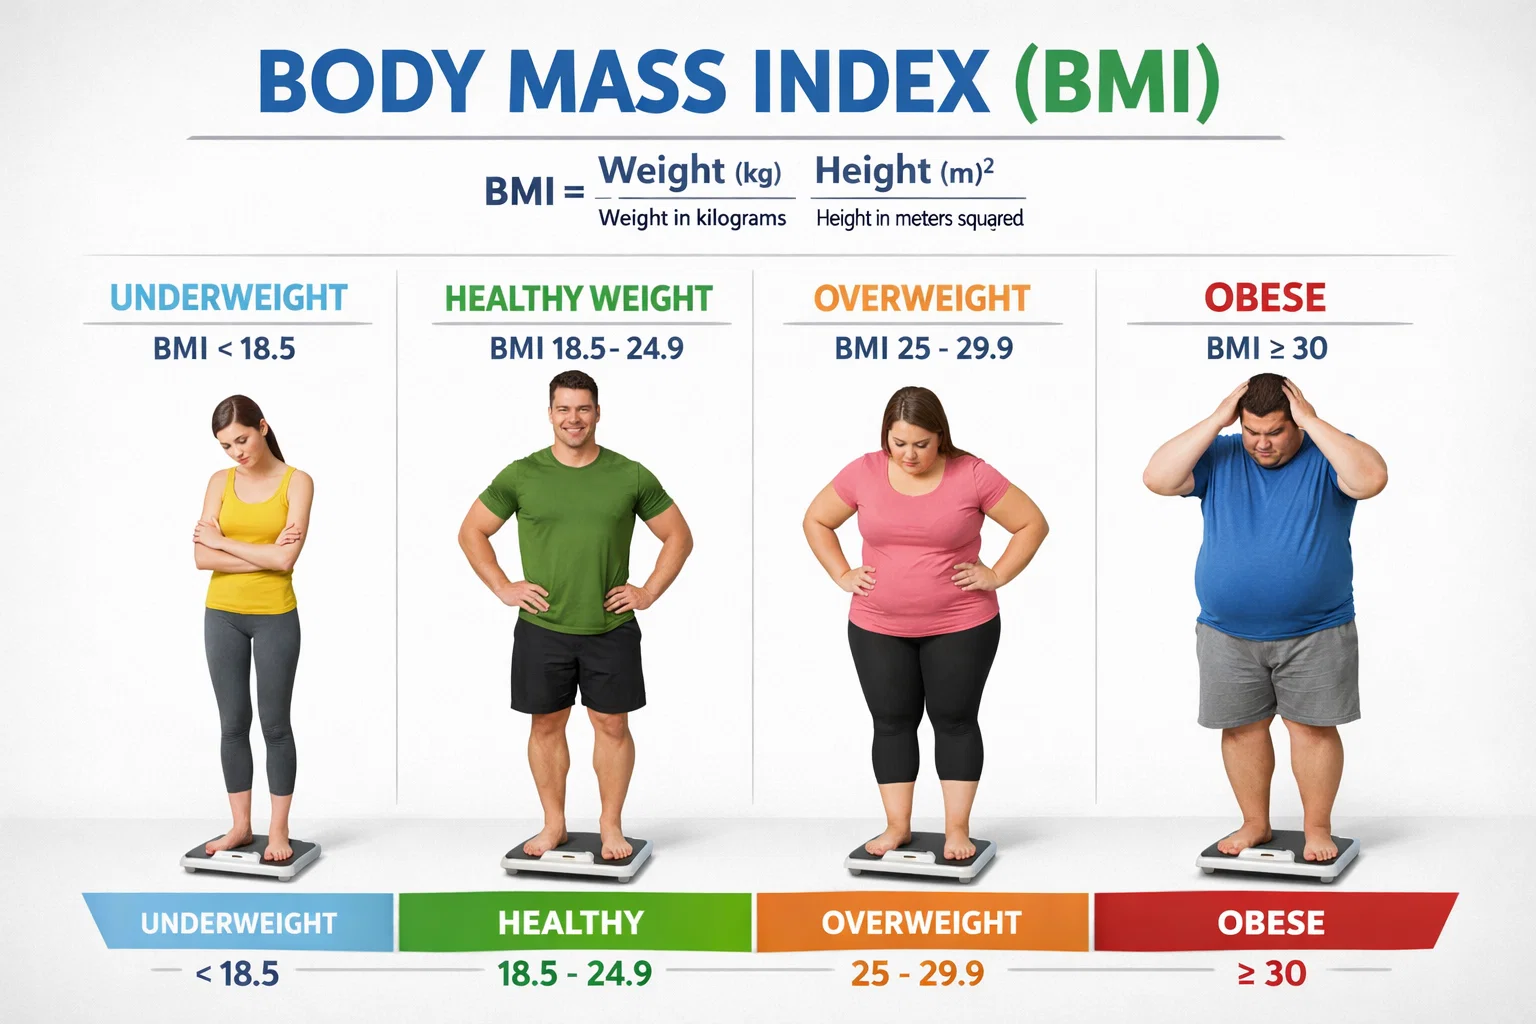
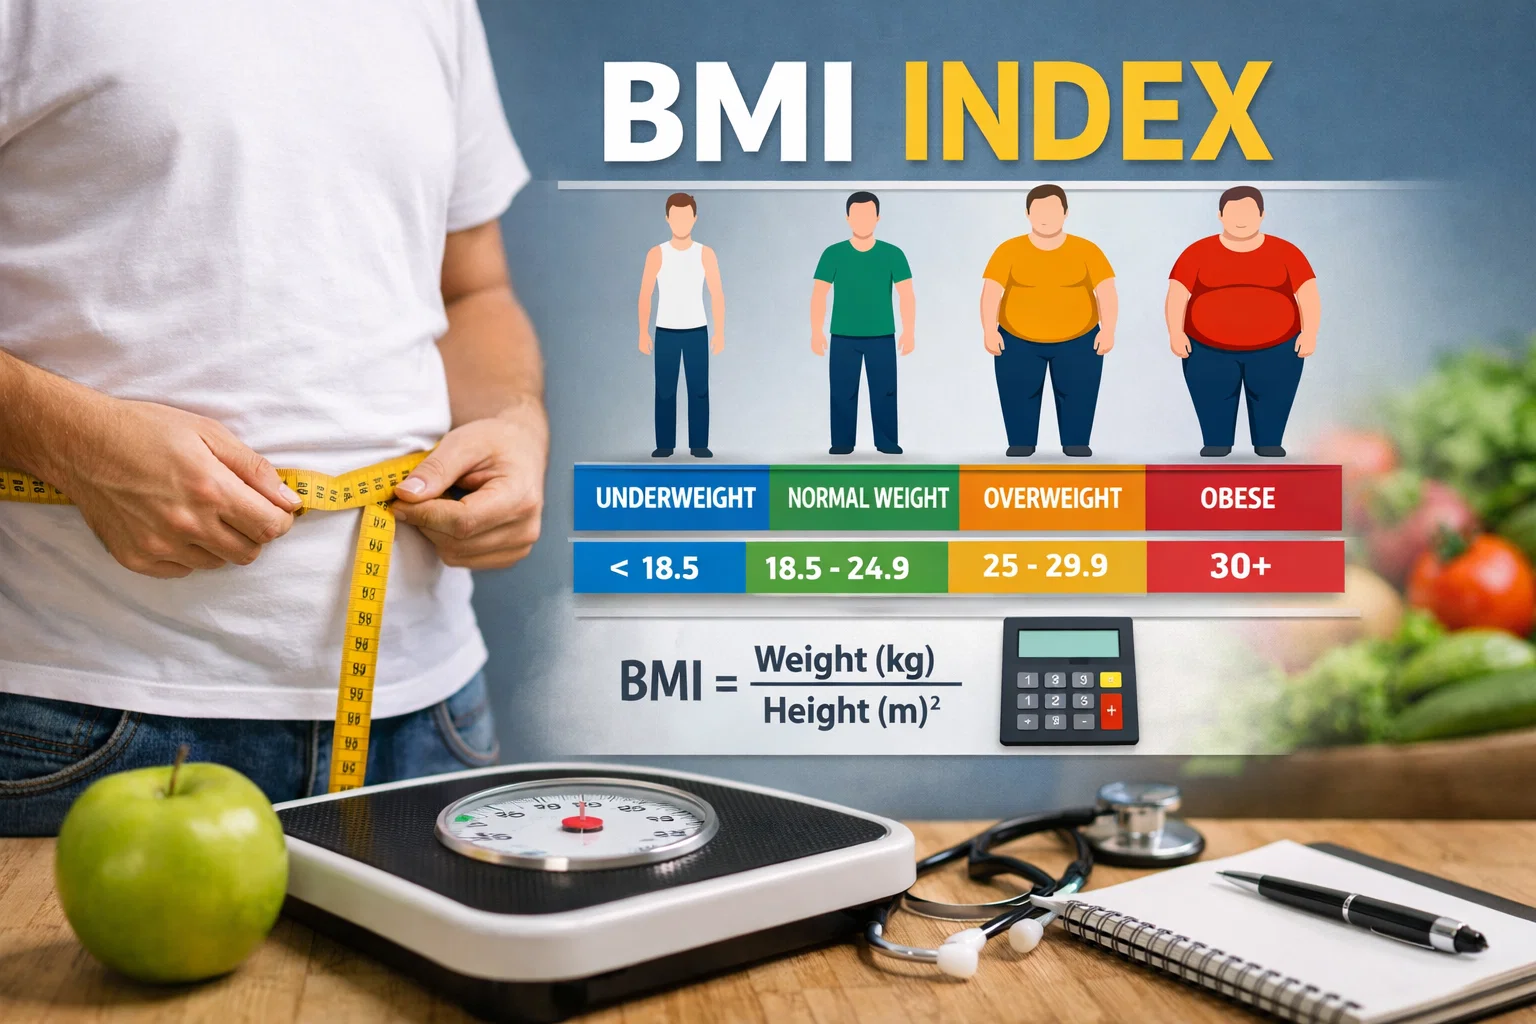
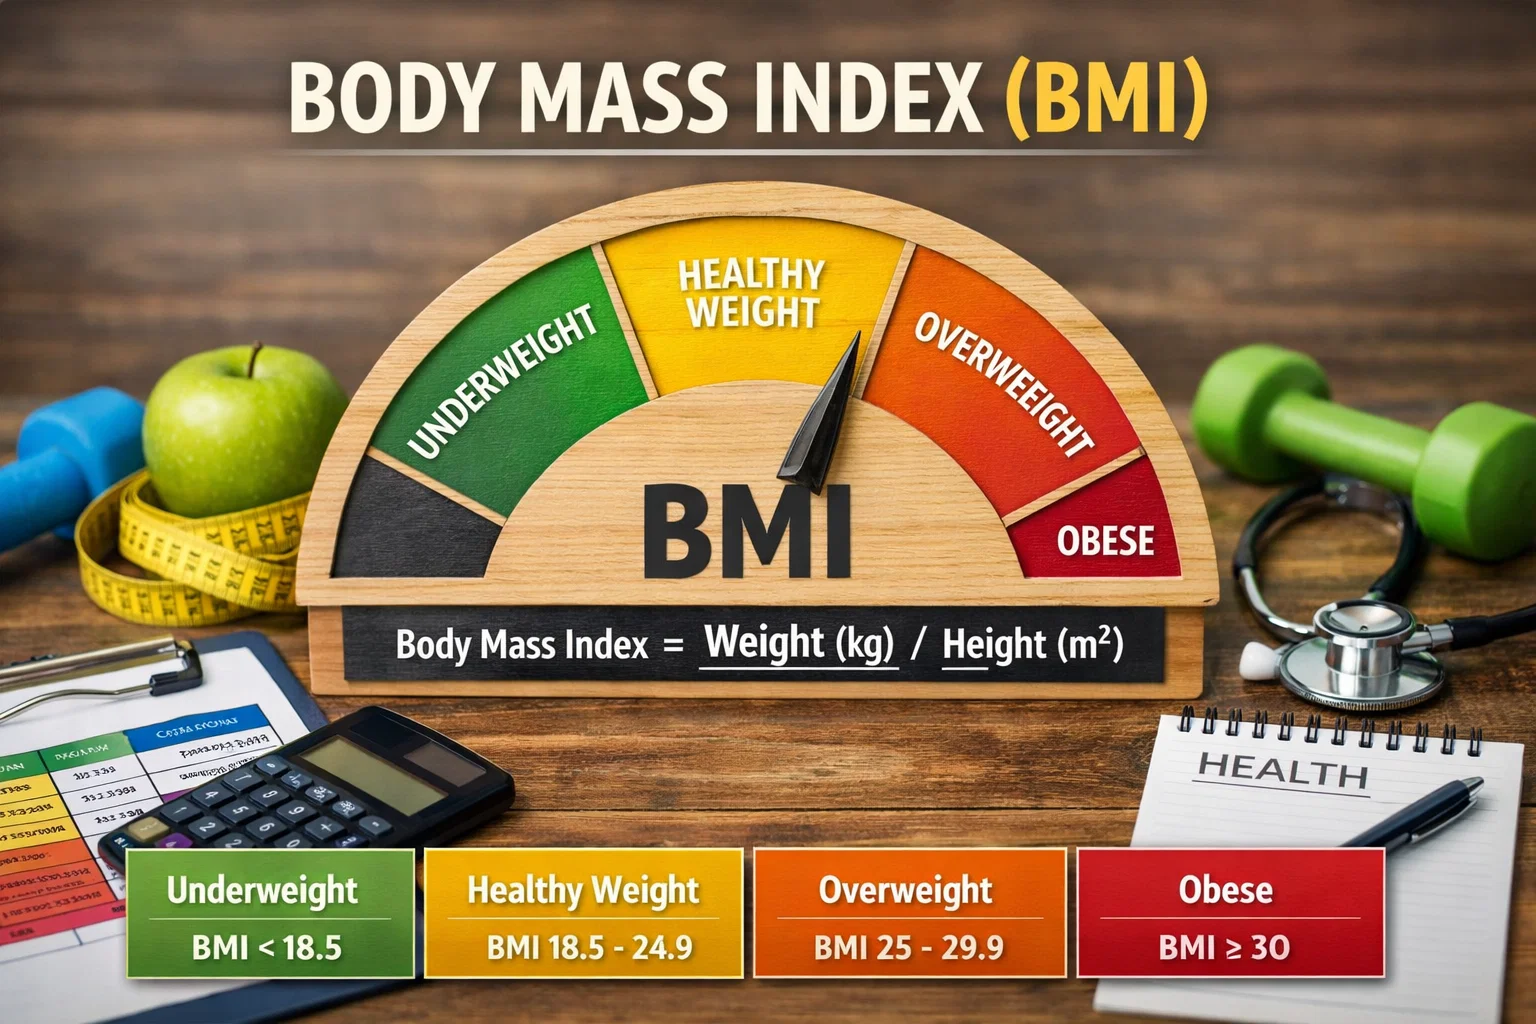
| BMI Score | Weight Status |
|---|---|
| Below 18.5 | Underweight |
| 18.5 – 24.9 | Normal BMI Range |
| 25.0 – 29.9 | Overweight |
| 30.0 or Higher | Obese |
Underweight / Normal / Overweight / Obese
Normal Range
Staying within this range reduces the risk of serious health conditions. It indicates a healthy balance between height and weight for most adults.
Obesity Classes
Obesity is often subdivided: Class 1 (BMI 30-35), Class 2 (BMI 35-40), and Class 3 (BMI 40+), also known as severe or „morbid” obesity.
BMI & Normal Ranges
Official WHO Standards:
BMI by Age
While the formula for BMI is the same for everyone, the interpretation changes based on age:
- Adults: Interpreted using fixed weight categories.
- Children & Teens (2-19): Interpreted using percentiles. A child's BMI is compared to others of the same age and sex because body fat changes as they grow.
- Seniors (65+): Some research suggests that a slightly higher normal BMI range (23-27) may be protective against frailty and bone loss.
BMI and Health Risks
Falling outside the healthy range is linked to several clinical risks:
Low BMI Risks: Weakened immune system, osteoporosis, anemia, and fertility issues.
When BMI is Misleading
BMI is a screening tool, not a diagnostic one. It can be inaccurate for:
- Athletes: High muscle mass can result in an "overweight" BMI.
- Pregnant Women: BMI does not account for the weight of the baby and placenta.
- Different Ethnicities: Research shows that health risks can start at lower BMI levels for Asian populations (e.g., risk increases at 23.0).
Frequently Asked Questions
A: The formula is the same, but women generally have more body fat than men at the same BMI score.
A: Checking once every few months is sufficient to track trends in your weight management.